Charts with campaign performance
On the MODIVO Ads campaign page, charts illustrating the effectiveness of a given advertising campaign have been added to the dashboard. By using this option, the user can visually compare all 8 available metrics:
Product clicks, Product views, CTR (Click-Through Rate), CPC (Cost Per Click), Cost, Sales value, ROAS (Return on Ad Spend), Items sold.
Thanks to charts, advertisers can quickly and conveniently verify both current and historical data, enabling constant monitoring and timely response to advertising campaign results.

Additional metrics
On the campaign page of MODIVO Ads panel additional metrics have also been introduced to enable a more in-depth analysis of the ongoing activities. The new metrics include: CTR (Click-Through Rate), Avg. CPC (Average Cost Per Click), Items sold & Sales value.

Product ranking
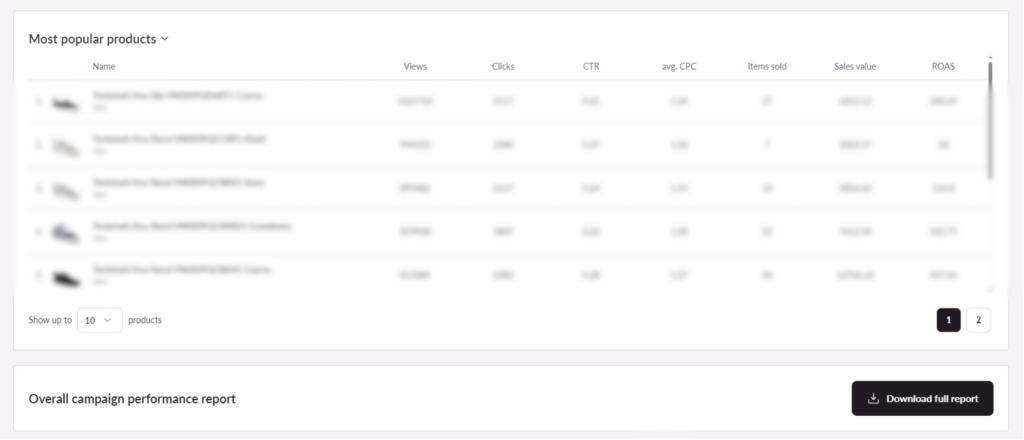
Within the product ranking feature, users can see a list of up to 100 SKUs that achieve the best results in a given campaign. There are two available views: “Best Performing Products,” comparing Sales value, and “Most Popular Products,” comparing the Views metric.

New campaign status
The new campaign status feature informs the user that their campaign will no longer be active once the daily budget is spent.
If the daily budget is spent, an icon appears next to the campaign status on the campaign list, indicating an issue with the execution. The red text below immediately explains what happened. The alert icon also appears next to the daily budget. Hovering over the icon (both next to the status and daily budget) displays a tooltip with information on when the budget was spent, along with the option to navigate to the campaign editing page.
You can now check the above features yourself using your MODIVO Ads account. Keep following our website to stay updated on all the latest news and changes about our digital advertising platform.


